...except for places like hospitals, prisons and old peoples homes.
What do you think? We've all seen the videos of the police harassing certain members of the public who seem to be doing their best to comply with the restrictions. Undoubtedly there are also many times more incidents of the police having to move idiots who aren't complying along.
But in my opinion, the R-value amongst the general population is way below 1.0 - meaning in the general population the virus is doomed. The obviously depends on where you are in the world right now, in the UK a lockdown was introduced a couple of weeks ago, Italy before that, whereas the US has only just gone into lockdown and other countries haven't started yet
However, in Italy which has been under lockdown for the greatest amount of time deaths are (slowly) falling.

The peak in Italy was roughly 20 days after the lockdown (represented by my L). The two charts simply show 14 days and 21 days since the lockdown. The timeline for coronavirus symptoms to appear and for deaths to occur varies hugely, but the average death is being reported at about 14 days after symptoms appear, which itself is about 5 days after infection...
It should be noted that there could be other reasons for a drop in coronavirus deaths; more capacity created to deal with the virus in hospitals, better or more equipment shipped into the region, or simply a change in the way deaths are reported (those dying at home being missed for example). But anecdotally it seems that Italy (and Spain) are getting a grip on the virus.
However, that graph tells us another thing. The decrease in deaths following the peak of the coronavirus is decreasing *very* slowly. It is in no way symmetrical to the increase that brought us to this point.
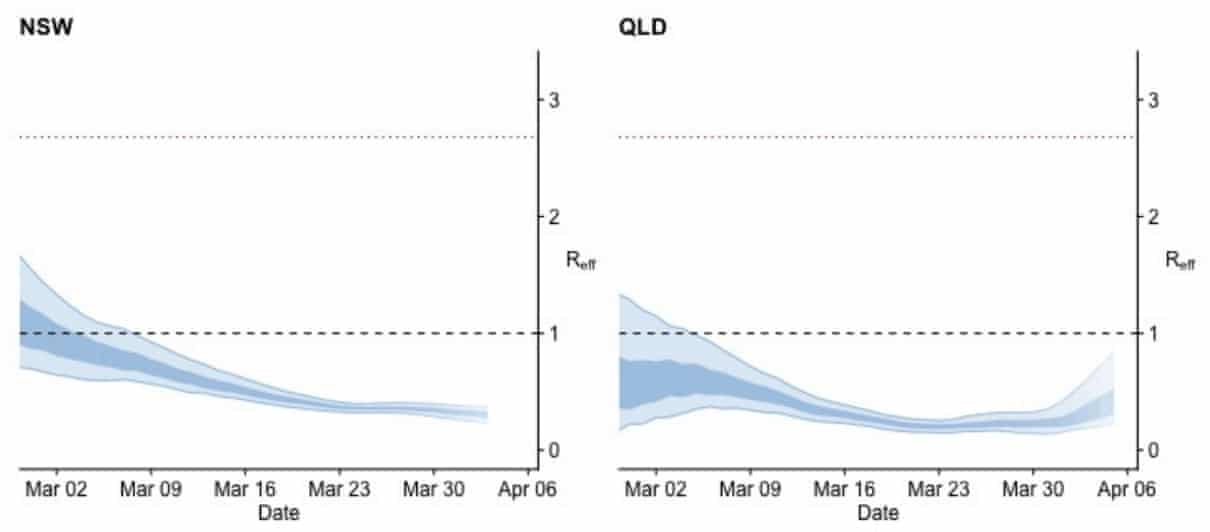
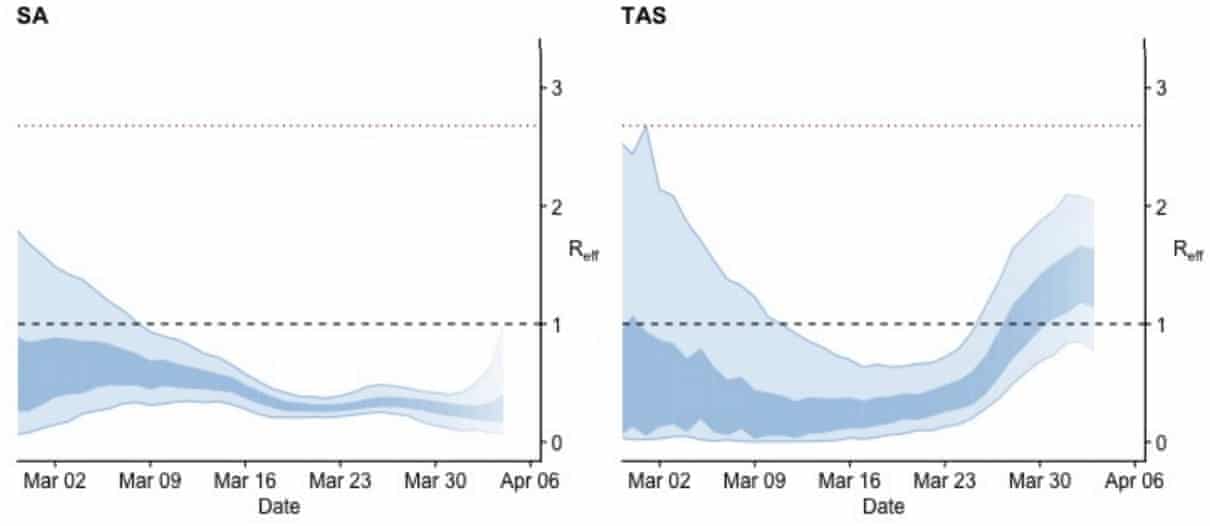
The most obvious explanation for this is that the R Value - that is, the "reproductive number" (i.e. the number of people each person with the diseases infects) - is not hugely below 1.0. If the R-value was around 0.76, then it will take 6 generations of the virus to decrease the number of people 25% of the peak. And if each generation is roughly 2 weeks, then we are talking 3 months to go from 900 deaths a day to 225 deaths a day.
This looks to be a large part of the problem.
It is being reported that the models used to estimate this virus (and life under lockdown) were using the assumption that it would be roughly symmetrical. That is, the decrease in new infections during lockdown would be roughly equal to the increase in new infections before it. This looks to have been a huge error.
By delaying the lockdown by a week, I think our governments may have delayed our return to "normality" by up to 3 months.
However, there is another explanation for "the long tail".
That is, the lockdown is working, and working well in the general population. However... it is not working at all in places like hospitals, prisons, nursing homes and retirement homes.
This makes a lot more sense. We know that prisons, schools, hospitals and nursing homes are places where diseases spread quickly. Out of that list, only Schools have been closed.
But is there any evidence for this? Yes - a little.

We know that the elderly are more vulnerable to the disease, that's not what we are looking for. But if it's spreading around hospitals, nursing homes and retirement communities then we'd expect the "increase" in the number of deaths in those groups to be "increasing" faster than the increase in say - the age 30-39 range.
And yes, that's exactly what we are seeing. The increase in deaths amongst those aged +40 years old is increasing faster than the rest of the population, and the increase in increase is increasing faster. That being said, it's not clear cut. Deaths from those aged 50-59 seem to be increasing at the same rate as those aged 70-89.
We need more data. I haven't included Spain in this because I couldn't find the statistics that I needed. I haven't included any other country as Italy are the likes of France and the UK aren't far enough along the timeline yet to get good data.
I haven't looked at confirmed cases because Italy like the UK isn't testing properly. But there is probably good data available from some countries that are testing.
In conclusion, the R-value in the general population is probably now less than 1.0 in the general population of countries in lockdown. And is probably anywhere from 0.5 to 0.8 (bit of a guess). But the virus could be spreading at a level above 1.0 in places where many people are in close proximity i.e. prisons, hospitals, nursing homes, retirement communities, places of work that are still active (BBC, ITV, etc) and public transport. It's these that need to be the focus.
Not people walking their dogs.
TL;Dr
By delaying the lockdown a week, the government delayed re-opening society by two-three months
What do you think? We've all seen the videos of the police harassing certain members of the public who seem to be doing their best to comply with the restrictions. Undoubtedly there are also many times more incidents of the police having to move idiots who aren't complying along.
But in my opinion, the R-value amongst the general population is way below 1.0 - meaning in the general population the virus is doomed. The obviously depends on where you are in the world right now, in the UK a lockdown was introduced a couple of weeks ago, Italy before that, whereas the US has only just gone into lockdown and other countries haven't started yet
However, in Italy which has been under lockdown for the greatest amount of time deaths are (slowly) falling.
The peak in Italy was roughly 20 days after the lockdown (represented by my L). The two charts simply show 14 days and 21 days since the lockdown. The timeline for coronavirus symptoms to appear and for deaths to occur varies hugely, but the average death is being reported at about 14 days after symptoms appear, which itself is about 5 days after infection...
It should be noted that there could be other reasons for a drop in coronavirus deaths; more capacity created to deal with the virus in hospitals, better or more equipment shipped into the region, or simply a change in the way deaths are reported (those dying at home being missed for example). But anecdotally it seems that Italy (and Spain) are getting a grip on the virus.
However, that graph tells us another thing. The decrease in deaths following the peak of the coronavirus is decreasing *very* slowly. It is in no way symmetrical to the increase that brought us to this point.
The most obvious explanation for this is that the R Value - that is, the "reproductive number" (i.e. the number of people each person with the diseases infects) - is not hugely below 1.0. If the R-value was around 0.76, then it will take 6 generations of the virus to decrease the number of people 25% of the peak. And if each generation is roughly 2 weeks, then we are talking 3 months to go from 900 deaths a day to 225 deaths a day.
This looks to be a large part of the problem.
It is being reported that the models used to estimate this virus (and life under lockdown) were using the assumption that it would be roughly symmetrical. That is, the decrease in new infections during lockdown would be roughly equal to the increase in new infections before it. This looks to have been a huge error.
By delaying the lockdown by a week, I think our governments may have delayed our return to "normality" by up to 3 months.
However, there is another explanation for "the long tail".
That is, the lockdown is working, and working well in the general population. However... it is not working at all in places like hospitals, prisons, nursing homes and retirement homes.
This makes a lot more sense. We know that prisons, schools, hospitals and nursing homes are places where diseases spread quickly. Out of that list, only Schools have been closed.
But is there any evidence for this? Yes - a little.
We know that the elderly are more vulnerable to the disease, that's not what we are looking for. But if it's spreading around hospitals, nursing homes and retirement communities then we'd expect the "increase" in the number of deaths in those groups to be "increasing" faster than the increase in say - the age 30-39 range.
And yes, that's exactly what we are seeing. The increase in deaths amongst those aged +40 years old is increasing faster than the rest of the population, and the increase in increase is increasing faster. That being said, it's not clear cut. Deaths from those aged 50-59 seem to be increasing at the same rate as those aged 70-89.
We need more data. I haven't included Spain in this because I couldn't find the statistics that I needed. I haven't included any other country as Italy are the likes of France and the UK aren't far enough along the timeline yet to get good data.
I haven't looked at confirmed cases because Italy like the UK isn't testing properly. But there is probably good data available from some countries that are testing.
In conclusion, the R-value in the general population is probably now less than 1.0 in the general population of countries in lockdown. And is probably anywhere from 0.5 to 0.8 (bit of a guess). But the virus could be spreading at a level above 1.0 in places where many people are in close proximity i.e. prisons, hospitals, nursing homes, retirement communities, places of work that are still active (BBC, ITV, etc) and public transport. It's these that need to be the focus.
Not people walking their dogs.
TL;Dr
By delaying the lockdown a week, the government delayed re-opening society by two-three months
Last edited: