Top 7 Premier League attack patterns

x42bn6

Full Member
Joined
Jun 23, 2008
Messages
18,887
Location
西田麻衣の谷間. Being a nerd, geek and virgin
I thought this might be interesting for some of you.

Premier League attack patterns visualised

Yesterday, I posted some visualisations of approach play in the Premier League. They describe how passes into a 'shooting zone' in front of the goal tend to be more successful when they come directly, rather than from wide areas.

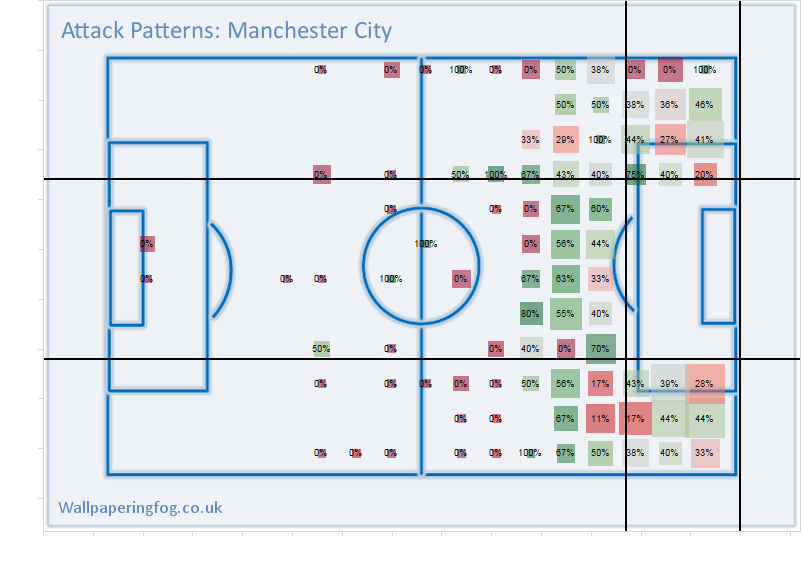
I've started to play with these visualisations for individual teams and a few people have asked how they look, so today I'm posting attack patterns for the current Premier League top seven. We're looking at the number and success rate of passes played into a boxed-out 'shooting zone'. Data covers the first half of the current Premier League season, up to the end of January.

For the following heat maps...

Size of square = number of passes
Colour of square = pass success rate

Large and green is good; large and red is not! It's important to look for clusters of colour rather than concentrating on individual squares because when we're looking at only one team, the number of passes included is lower.


Teams are attacking the goal on the right and are listed in order of current league position. Yes, I picked top seven because everybody wants to see how the Man United one looks.


Chelsea

Mixed approach with occasional long passes from deep. Larger number of incomplete passes from wide on the right.


Arsenal
High success rates with close, central passes and very rarely played long from deep. Significant volume of passes from advanced wide positions, but with low success rates.


Manchester City
Varied approach with good success rates from almost all areas.


Liverpool
Mixed approach with low volume of passes from very wide touchline positions. Attacks from right wing weaker than left.


Tottenham Hotspur
Greater success rates through the centre than from either wing, but high volumes of unsuccessful passes played from advanced and wide.


Everton
The Leighton Baines effect. High volume of passes from wide left but with low completion rates. Passes from advanced right also with low completion. Very few attempts through the centre and occasional long balls from deep.


Manchester United
Some approaches through the centre but attacks weighted towards wings. High volume of longer diagonal balls from the right, with low success rates.

http://www.wallpaperingfog.co.uk/2014/02/premier-league-attack-patterns.html

Ours doesn't include the 2-2 against Fulham.
 

Sixpence

Erroneously Promoted
Joined
Nov 30, 2012
Messages
15,231
Location
Offside
I really hate all these new heat maps things that are creeping in to the layman's football analysis. Bollocks to your touch maps and your heat maps.
 

Gannicus

New Member
Joined
Dec 3, 2013
Messages
3,723
I don't understand the objection to heat maps. They're a tool for assessing what's going on that may not be obvious. We have the naked eye, we have stats and we have heat maps. What's the problem?

Common sense tells us anyway that overreliance on one tactic will be dealt with easily enough by opposing defenses, short of pure athletic and technical brilliance. You know, for example, what Messi will do to you but you are helpless to stop him. Short of having a Messi on the squad we need to vary our attacks so that an opposing defense has to worry about everything that might come their way, including the occasional cross. The maps above help substantiate the point.
 

amolbhatia50k

Sneaky bum time - Vaccination status: dozed off
Joined
Nov 8, 2002
Messages
96,006
Location
india
I'm all for using visual and statistical aids to look deeper beneath the surface.

But those maps just look a bit pointless. They've created so many different areas on the pitch it doesn't really give much meaning.

Also it looks a bit off. Everton's looks very strange.
 

surf

Full Member
Joined
May 30, 2007
Messages
6,728
Location
In the wilderness
This seems to confirm the conventional wisdom that our wide men are putting in large volumes of low percentage passes/crosses. Adding the Fulham data would only exacerbate that.
 

Smores

Full Member
Joined
May 18, 2011
Messages
25,660
So for all the comparisons on here Everton have a similar amount of play out wide?

To be fair those diagrams lack context and only provide part of the picture. Still of use though.

Chelsea, City, Liverpool look like they have width but pass it rather than lump in a cross.
 

Vooon

Full Member
Joined
Feb 17, 2012
Messages
2,600
Location
Hal Institute for Criminally Insane Robots
That's a quite depressing illustration of how bad our delivery is compared to the current top four. What would be interesting though, is to see these charts for the previous seasons to have something to compare it with. Especially the 2010/11 when Nani was on fire:

2010/2011
- Voted Player of the Year by his team mates
- Named Man of the Match 6 times (only Tevez, 7, and Van Persie, 8, had more)
- Started 31 games, played in 33
- Assisted 14 goals, more than any player in the league
- Scored 9 league goals (notably against City and Spurs) and a total of 10.
- 2.5 successful dribbles per game (2nd highest in the league)
- 0.70 goals/assists per game. For comparison: Walcott 0.57, Young 0.5, Arshavin 0.46, Silva 0.31, Milner 0.19.