I liked your raw data and I had been following it since the beginning, thank you. It helps to get a picture of the situation. But I believe that the graphs that I had been positing everyday and that today
@Sweet Square posted STEALING MY feckING JOB!!!

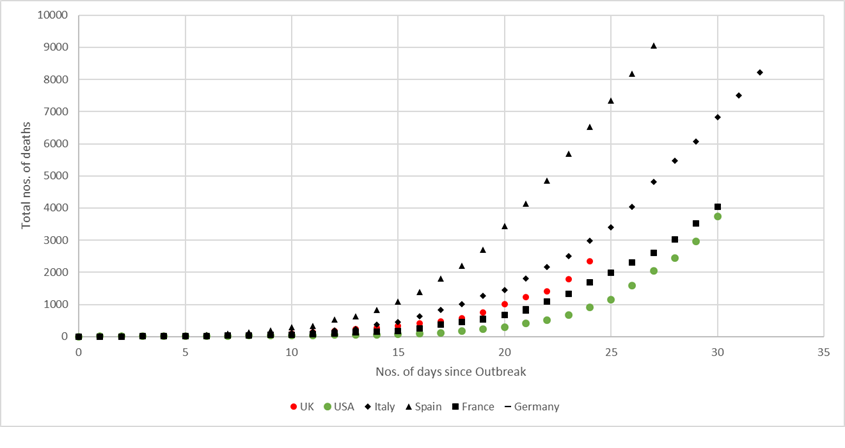
are in agreement with your data but the author, as I mentioned one of the days because
@Sweet Square is not doing MY JOB WELL!!!... is counting from the 10th day of infection. Probably because the beginning is too randomly to take in account? but I must confess that I don't know much about statistic methods. I just love numbers and try to understand the situation that we are living in. If we take your numbers (and percentage of growth) and we use his method will see that UK is following Italy's path. And most important, his % is ramping up for the last 3 days compared with Italy and is matching Spain's growth when they were around 2000 deaths. Again, please someone correct me as maybe I must be talking bollocks. But would you agree with me? Of course we would need to agree if it is more realistic take it from the 1st death or the 10th. And of course % goes smaller as bigger the numbers. That is why is call reaching the peak. But by percentage at 2000 deaths, Uk is slightly worse than Italy to reach the peak (so improvement needs to be made)
Uk dates | UK deaths | UK % | Italy Dates | Italy Deaths | Italy % | Spain Dates | Spain Deaths | Spain % |
Mar 12th | 10 | 25,00% | Feb 25th | 11 | 57,14% | Mar 7th | 10 | 25,00% |
Mar 13th | 11 | 10,00% | Feb 26th | 12 | 9,09% | Mar 8th | 17 | 70,00% |
Mar 14th | 21 | 90,91% | Feb 27th | 17 | 41,67% | Mar 9th | 30 | 76,47% |
Mar 15th | 35 | 66,67% | Feb 28th | 21 | 23,53% | Mar 10th | 36 | 20,00% |
Mar 16th | 55 | 57,14% | Feb 29th | 29 | 38,10% | Mar 11th | 55 | 52,78% |
Mar 17th | 71 | 29,09% | Mar 1st | 41 | 41,38% | Mar 12th | 86 | 56,36% |
Mar 18th | 104 | 46,48% | Mar 2nd | 52 | 26,83% | Mar 13th | 133 | 54,65% |
Mar 19th | 144 | 38,46% | Mar 3rd | 79 | 51,92% | Mar 14th | 196 | 47,37% |
Mar 20th | 177 | 22,92% | Mar 4th | 107 | 35,44% | Mar 15th | 294 | 50,00% |
Mar 21st | 233 | 31,64% | Mar 5th | 148 | 38,32% | Mar 16th | 342 | 16,33% |
Mar 22nd | 281 | 20,60% | Mar 6th | 197 | 33,11% | Mar 17th | 533 | 55,85% |
Mar 23rd | 335 | 19,22% | Mar 7th | 233 | 18,27% | Mar 18th | 639 | 19,89% |
Mar 24th | 422 | 25,97% | Mar 8th | 366 | 57,08% | Mar 19th | 833 | 30,36% |
Mar 25th | 468 | 10,90% | Mar 9th | 463 | 26,50% | Mar 20th | 1093 | 31,21% |
Mar 26th | 578 | 23,50% | Mar 10th | 631 | 36,29% | Mar 21st | 1381 | 26,35% |
Mar 27th | 759 | 31,31% | Mar 11th | 827 | 31,06% | Mar 22nd | 1813 | 31,28% |
Mar 28th | 1019 | 34,26% | Mar 12th | 1016 | 22,85% | Mar 23rd | 2207 | 21,73% |
Mar 29th | 1228 | 20,51% | Mar 13th | 1266 | 24,61% | Mar 24th | 2696 | 22,16% |
Mar 30th | 1408 | 14,66% | Mar 14th | 1441 | 13,82% | Mar 25th | 3434 | 27,37% |
Mar 31st | 1789 | 27,06% | Mar 15th | 1809 | 25,54% | Mar 26th | 4145 | 20,70% |
Apr 1st | 2352 | 31,47% | Mar 16th | 2158 | 19,29% | Mar 27th | 4858 | 17,20% |
Apr 2nd | | | Mar 17th | 2503 | 15,99% | Mar 28th | 5690 | 17,13% |
| | | Mar 18th | 2978 | 18,98% | Mar 29th | 6528 | 14,73% |
| | | Mar 19th | 3405 | 14,34% | Mar 30th | 7240 | 10,91% |
| | | Mar 20th | 4032 | 18,41% | Mar 31st | 8189 | 13,11% |
| | | Mar 21st | 4825 | 19,67% | Apr 1st | 9053 | 10,55% |
| | | Mar 22nd | 5475 | 13,47% | Apr 2nd | | |
| | | Mar 23rd | 6077 | 11,00% | | | |
| | | Mar 24th | 6820 | 12,23% | | | |
| | | Mar 25th | 7503 | 10,01% | | | |
| | | Mar 26th | 8215 | 9,49% | | | |
| | | | | | | | |
| | | | | | | | |
steal that
@Sweet Square 


 Cant we just stick with the experts and feck off people like Peston? Allow him to report on stories of kittens being stuck up trees and the like?