
Yep, how many people are going to disregard the 3 family rule and being 6 or 7 families together just for the sake of it.. there won't be any enforcement around Christmas too, so I'm sure there'll be loads taking advantage.Is there justification for London to be in tier 3?
personally I think this drive towards allowing so many people to mix at Christmas is a massive mistake.
really do not see the big deal in having a small Christmas for one year. This 5 day mixing, will get out of control and be the most damaging period of the entire year.
SARS CoV-2 coronavirus / Covid-19 (No tin foil hat silliness please)
- Thread starter Don't Kill Bill
- Start date
Berbasbullet
Too Boring For A Funny Tagline
- Joined
- Nov 3, 2011
- Messages
- 20,276
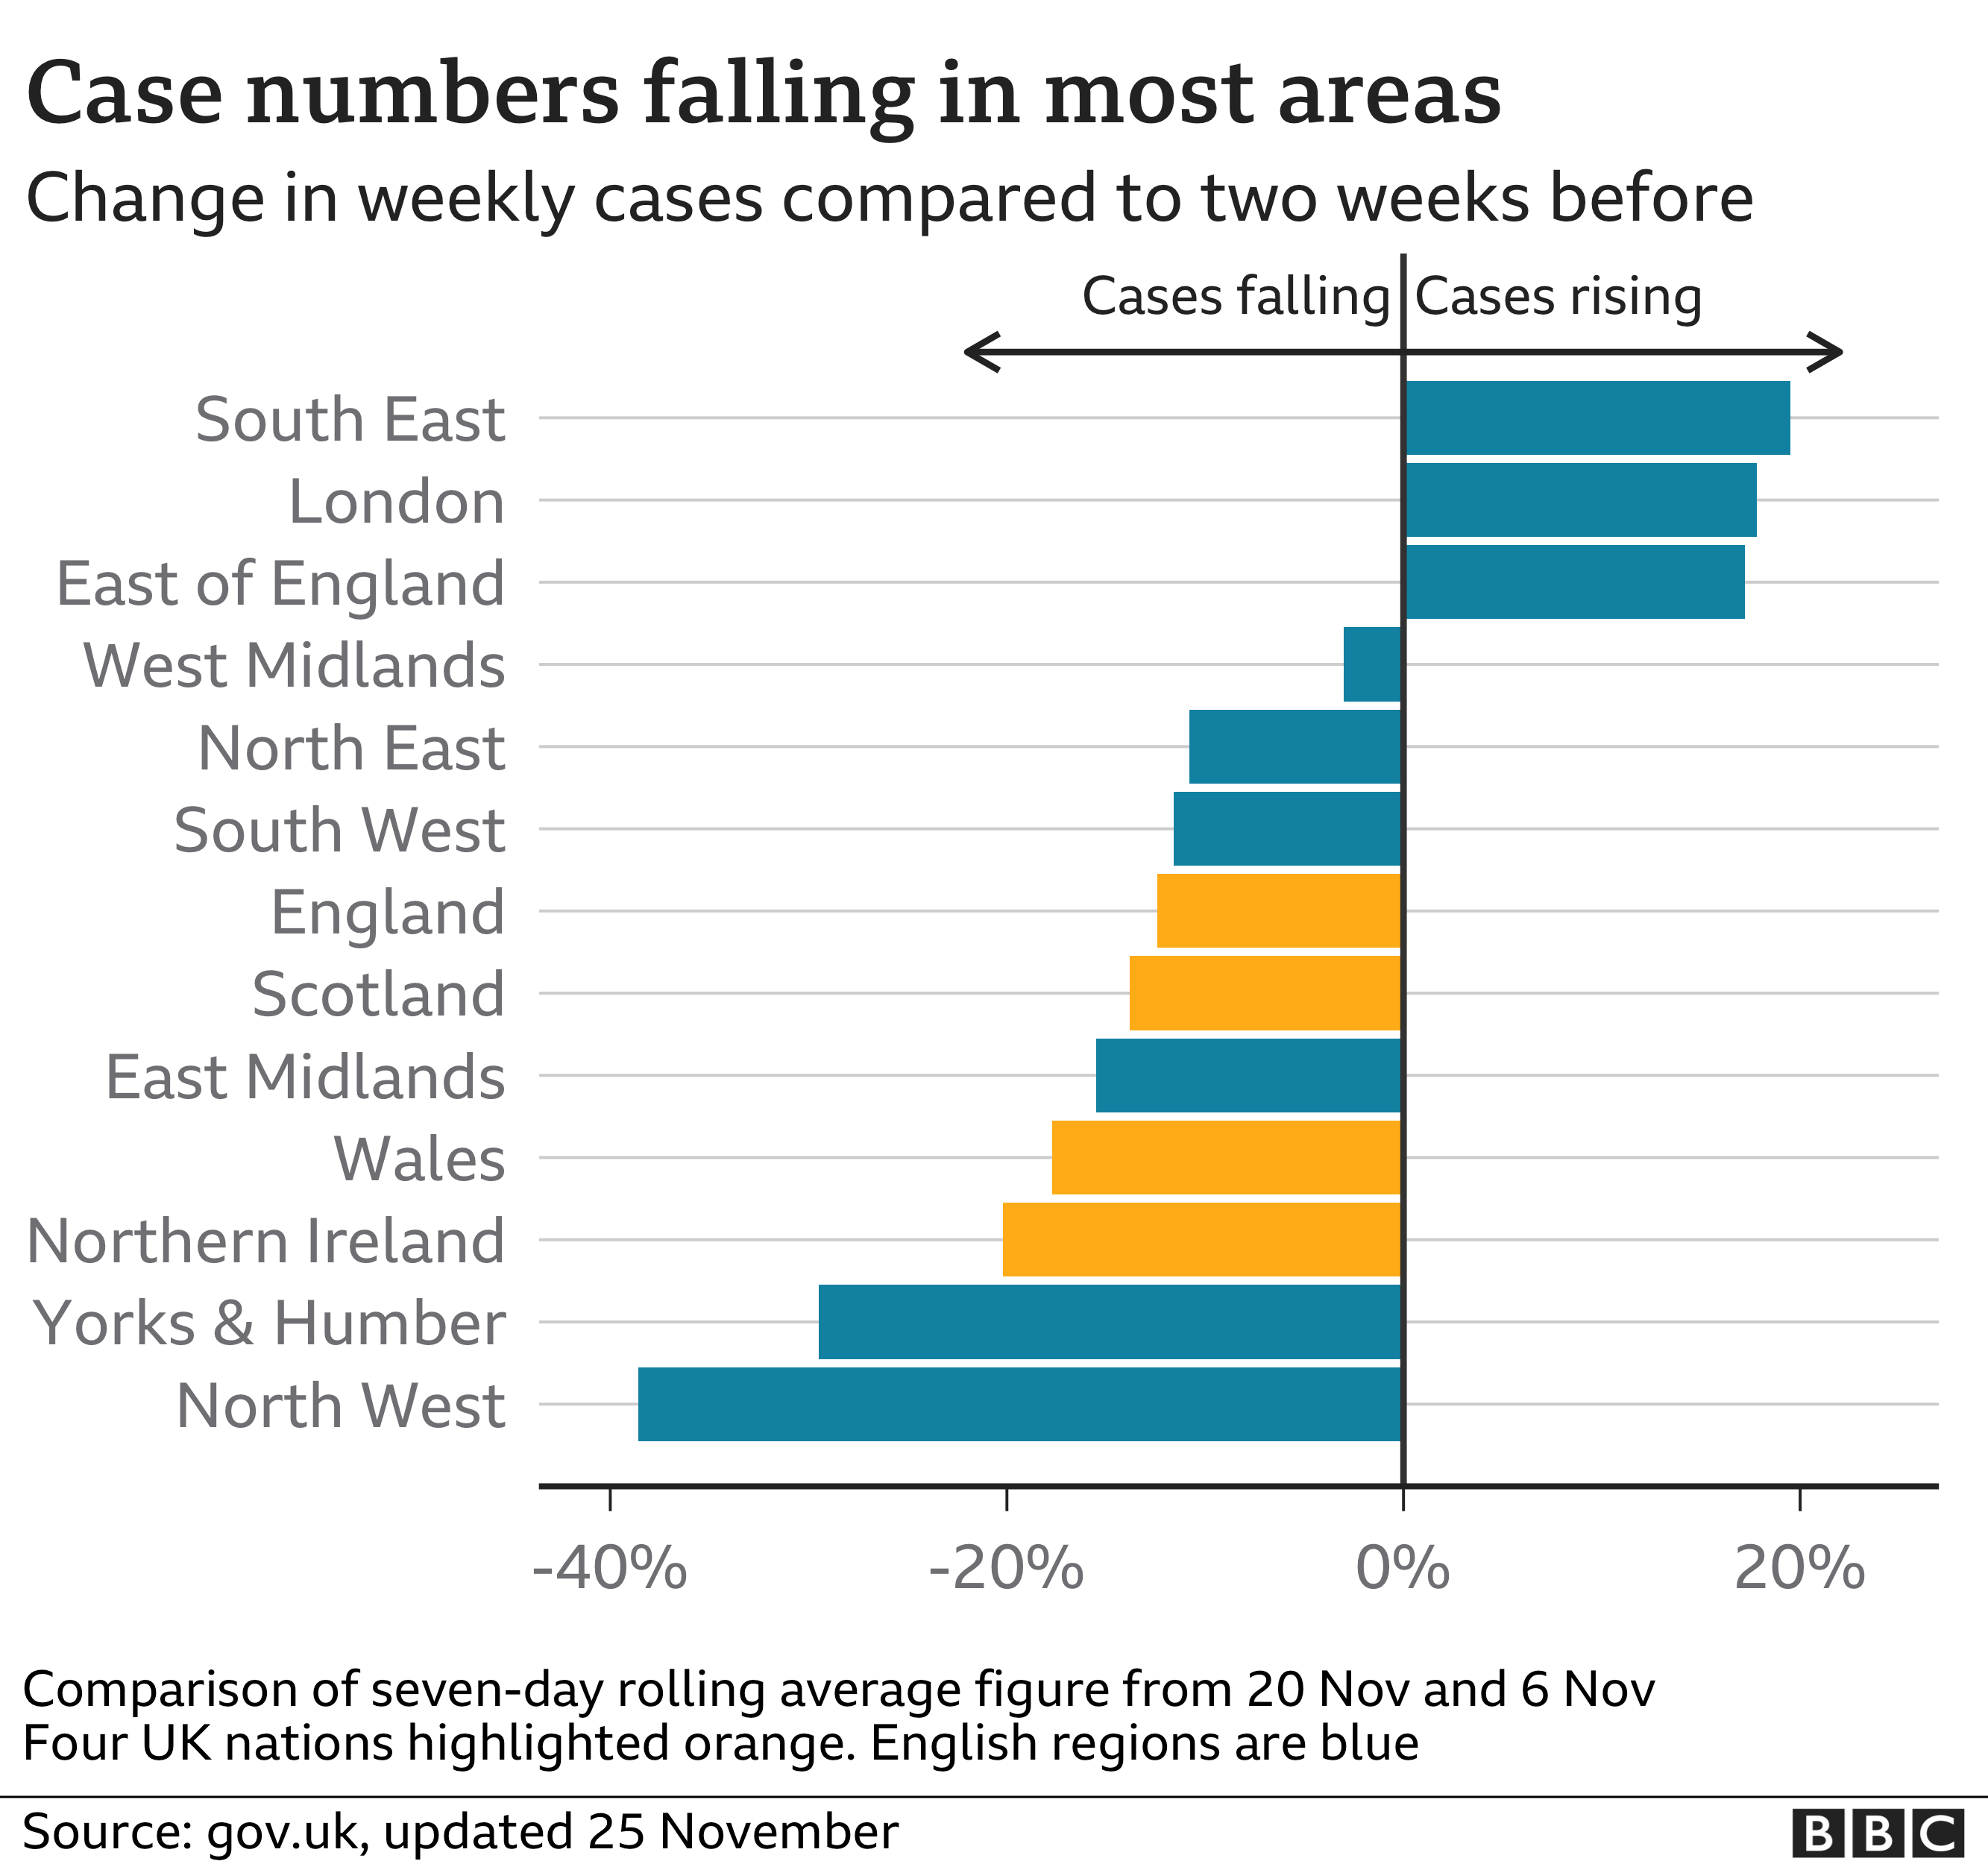
You know why...how the hell are we in tier 3 in Manchester when the R rate for North West is the best in the country?
ClaytonBlackmoorLeftPeg
Full Member
- Joined
- May 22, 2017
- Messages
- 13,122
it will be carnage. It’s frankly going to be a free for all, and that’s how many people will see it. It’s basically being let out of prison for 5 days and you can go and do what you want.Yep, how many people are going to disregard the 3 family rule and being 6 or 7 families together just for the sake of it.. there won't be any enforcement around Christmas too, so I'm sure there'll be loads taking advantage.
and yes there won’t be any enforcement, which to a large extent I agree with, unless people are having large scale gatherings/ parties.last thing we need is the police breaking up people’s Xmas dinner!
DomesticTadpole
Doom-monger obsessed with Herrera & the M.E.N.
We all should have moved to the Isle of Wight.You know why...
Vidyoyo
The bad "V"
Yeah boy, Tier 3 
FootballHQ
Full Member
- Joined
- Nov 17, 2017
- Messages
- 18,274
- Supports
- Aston Villa
Pretty much no change then if you're in Tier 3 from next week?
DomesticTadpole
Doom-monger obsessed with Herrera & the M.E.N.
No.Pretty much no change then if you're in Tier 3 from next week?
OnlyTwoDaSilvas
Gullible
Visiting family? Nah get fecked.As before, social mixing outside of households or support bubbles will not be allowed indoors.
Spectators will be allowed to watch sport in tier 2, with a maximum crowd capacity outdoors of 50% of the capacity of the stadium or 2,000 people, whichever is smaller. Indoors, the maximum capacity is 1,000.
Watching a sporting event? Sure, bring 999 of your mates.
Pretty nice of covid to not make its way into such venues.
Ananke
Full Member
Is there justification for London to be in tier 3?
Nou_Camp99
what would Souness do?
- Joined
- Apr 1, 2013
- Messages
- 10,274
Because we have some of the fullest hospitals. The R number is only part of it sadly.how the hell are we in tier 3 in Manchester when the R rate for North West is the best in the country?
One Night Only
Prison Bitch #24604
Exactly, absolute bullshit. Nobody is going to pay attention now due to it being one rule for London and another for everywhere else.
Hammerfell
Full Member
- Joined
- Apr 26, 2015
- Messages
- 7,778
I’m in the tier 3 club. Time for a revolution.
Hoof the ball
Full Member
It's a piss take at this point. Special pleading bs in regards to London. "we're tier 2 because we're London" kind of argument.
I’m in tier 1 in Cornwall and have been for the past month@Pexbo Tier 3 assemble!

- Joined
- Dec 31, 2007
- Messages
- 86,562
Traitor.I’m in tier 1 in Cornwall and have been for the past month
I’ll enjoy my traitorous pint of draft ale next weekTraitor.
Dan_F
Full Member
- Joined
- Dec 17, 2012
- Messages
- 10,406
So in Bath, 2000 people can come and watch the rugby, even though 10 miles away Bristol is in tier 3.Visiting family? Nah get fecked.
Watching a sporting event? Sure, bring 999 of your mates.
Pretty nice of covid to not make its way into such venues.
Ekkie Thump
Full Member
- Joined
- Mar 9, 2013
- Messages
- 3,892
- Supports
- Leeds United
Latest ONS stats herehow the hell are we in tier 3 in Manchester when the R rate for North West is the best in the country?
It also has a handy tool for finding out your local positivity rate. Here's the overview that shows the concentration of cases is most acute in the North West:
Basically even though the positivity rate is falling in the North West, it's still at the second highest positivity rate after Humberside - which is also tier 3. If you interact with that map it also indicates that the hardest hit areas in the country are, specifically, Blackburn (3.6) and
Last edited:
groovyalbert
it's a mute point
But I don't think our hospitals here are at the point where they need extreme protection. Could be wrong, however.It's a piss take at this point. Special pleading bs in regards to London. "we're tier 2 because we're London" kind of argument.
It will have been an economic decision. London's the UK's only international hub and with Brexit looming and trade negotiations on-going, it needs to be working.
ClaytonBlackmoorLeftPeg
Full Member
- Joined
- May 22, 2017
- Messages
- 13,122
and clearly that’s a key consideration, and rightly so. Perhaps transparency is the issue.But I don't think our hospitals here are at the point where they need extreme protection. Could be wrong, however.
It will have been an economic decision. London's the UK's only international hub and with Brexit looming and trade negotiations on-going, it needs to be working.
I’ve had recent conversations with people in Newcastle and Glasgow who are saying Boone is taking any notice of the restrictions in national lockdown. So why would we think this is going to change.
part fatigue clearly, but as the days go on, less and less people, where ever they are are adhering to the rules - or in fact the spirit of the rules, I.e pushing as far as legally allowed to.
Ekkie Thump
Full Member
- Joined
- Mar 9, 2013
- Messages
- 3,892
- Supports
- Leeds United
Burnham agrees with it.Andy Burnham will be fuming somewhere
Andy Burnham said:"We've got the fastest fall going on in cases at the moment, but there is a big but I'm afraid - and the big but is our cases are still quite a lot higher than the rest of England," he said.
"So we're coming down quickly, we're going in the right direction, but if I just look at all the evidence and take the evidence alone, the evidence points into tier three."
https://www.bbc.co.uk/news/live/uk-55082980 (12.37)
Ananke
Full Member
I think for me where it’s rather annoying is the transparency that’s not given. London is clearly being given special treatment. Yes, Greater Manchester as a whole has more cases per 100,000. It’s fall rate is massive in comparison to London’s.
You’d think anything that’s ‘rising’ should be nipped in the bud ASAP. And especially as London rates per 100k still aren’t anything to brag about. Also, not long ago it was all about the R rate, depending what the R rate was at would depend on the lockdown tiers implemented. These are the estimated figures from NHS England:
So, does the R rate not have any determining factor in the Tier regions go into?
You’d think anything that’s ‘rising’ should be nipped in the bud ASAP. And especially as London rates per 100k still aren’t anything to brag about. Also, not long ago it was all about the R rate, depending what the R rate was at would depend on the lockdown tiers implemented. These are the estimated figures from NHS England:
| Region | R | Growth rate % per day |
|---|---|---|
| England | 1.0-1.1 | 0 to +2 |
| East of England | 1.0-1.3 | +1 to +4 |
| London | 1.0-1.2 | 0 to +3 |
| Midlands | 1.0-1.2 | +1 to +3 |
| North East and Yorkshire | 1.0-1.1 | 0 to +2 |
| North West | 0.8-1.0 | -3 to 0 |
| South East | 1.1-1.3 | +1 to +4 |
| South West | 1.0-1.3 | +1 to +4 |
So, does the R rate not have any determining factor in the Tier regions go into?
Last edited:
Pogue Mahone
The caf's Camus.
% changes can be misleading. If cases low to begin with a small absolute increase can translate into a big % increase.
Nytram Shakes
cannot lust
it's simply that us British people are spoilt and have would have a massive hissy fit if they weren't allowed to have family Christmas.Is there justification for London to be in tier 3?
personally I think this drive towards allowing so many people to mix at Christmas is a massive mistake.
really do not see the big deal in having a small Christmas for one year. This 5 day mixing, will get out of control and be the most damaging period of the entire year.
We will also have a hissy fit afterwards when we have to be lockdown again, will blame everyone else for the fact that it costs peoples lives and jobs.
The biggest thing i'm taking away from this pandemic is that we are a country of overly entitled *****
You'll be able to get a haircut, play sports, and go clothes shopping, is about it.Pretty much no change then if you're in Tier 3 from next week?
Can't agree more with this.it's simply that us British people are spoilt and have would have a massive hissy fit if they weren't allowed to have family Christmas.
We will also have a hissy fit afterwards when we have to be lockdown again, will blame everyone else for the fact that it costs peoples lives and jobs.
The biggest thing i'm taking away from this pandemic is that we are a country of overly entitled *****
The fact that what we have here is called a "lockdown" is ridiculous in itself, and people acting as if all their rights have been taken away and they can't do anything.
Go and see the rest of Europe, with police giving fines for not wearing masks on the streets, enforcing country wide curfews etc. Places like Germany staying in lockdown until at least 20th December.
The elitism of people in this country is ridiculous, and it is understandable why the rest of Europe sees us as these ignorant pigs.
Brwned
Have you ever been in love before?
- Joined
- Apr 18, 2008
- Messages
- 50,848
Slight problem with that theory: it is not just the UK government relaxing restrictions for the holidaysit's simply that us British people are spoilt and have would have a massive hissy fit if they weren't allowed to have family Christmas.
We will also have a hissy fit afterwards when we have to be lockdown again, will blame everyone else for the fact that it costs peoples lives and jobs.
The biggest thing i'm taking away from this pandemic is that we are a country of overly entitled *****
One Night Only
Prison Bitch #24604
Even with those figures most if not all the NE is in tier 3, but it's clearly doing better than LondonI think for me where it’s rather annoying is the transparency that’s not given. London is clearly being given special treatment. Yes, Greater Manchester as a whole has more cases per 100,000. It’s fall rate is massive in comparison to London’s.
You’d think anything that’s ‘rising’ should be nipped in the bud ASAP. And especially as London rates per 100k still aren’t anything to brag about. Also, not long ago it was all about the R rate, depending what the R rate was at would depend on the lockdown tiers implemented. These are the estimated figures from NHS England:
Region R Growth rate % per day England 1.0-1.1 0 to +2 East of England 1.0-1.3 +1 to +4 London 1.0-1.2 0 to +3 Midlands 1.0-1.2 +1 to +3 North East and Yorkshire 1.0-1.1 0 to +2 North West 0.8-1.0 -3 to 0 South East 1.1-1.3 +1 to +4 South West 1.0-1.3 +1 to +4
So, does the R rate not have any determining factor in the Tier regions go into?

Oggmonster
Full Member
This logic where we're all just dickheads is a bit weird.Can't agree more with this.
The fact that what we have here is called a "lockdown" is ridiculous in itself, and people acting as if all their rights have been taken away and they can't do anything.
Go and see the rest of Europe, with police giving fines for not wearing masks on the streets, enforcing country wide curfews etc. Places like Germany staying in lockdown until at least 20th December.
The elitism of people in this country is ridiculous, and it is understandable why the rest of Europe sees us as these ignorant pigs.
It seems pretty normal people are frustrated with what is happening.
Not being allowed out properly in 9 or so months
It's now winter which is naturally going to piss more people off
A tier system where logic seems to go out the window somewhat
A government which clearly doesn't know what they're doing.
The fact it's approaching Christmas is a factor as well
I'm sure you can find people in Germany, Spain, Italy, France wherever who are pissed off at the whole thing as well. It's not exactly out of the ordinary to be frustrated by it all.
It seems more to more people love taking the high ground and feeling superior by talking down to people who dare miss normality and say it.
Berbasbullet
Too Boring For A Funny Tagline
- Joined
- Nov 3, 2011
- Messages
- 20,276
Enjoy everyone from Devon rampaging you guys!I’ll enjoy my traitorous pint of draft ale next week
UnrelatedPsuedo
I pity the poor fool who stinks like I do!
People need to stop trying to make sense of the Tiers and regions.
This government was elected. This is how they behave. Trying to parse some fairness in there is pointless.
This government was elected. This is how they behave. Trying to parse some fairness in there is pointless.
I feel like the Christmas break is just because they know a lot of people are going to break lockdown if it’s in place, which would quite rightly piss everyone else off. Coupled with trying to police it on Christmas Day, it’s probably just not worth having the lockdown. Potential uproar on both sides.
groovyalbert
it's a mute point
Sort of agree to be honest. For me, the only reason to impose lockdowns/restrictions is to protect hospitals/ensure other treatments can be administered. It's a real shame that after the first wave we haven't been better at making more space/opening up facilities to cope with what was always going to come. We should have utilised army facilities/doctors and demanded more from private hospitals that simply never took place.I feel like the Christmas break is just because they know a lot of people are going to break lockdown if it’s in place, which would quite rightly piss everyone else off. Coupled with trying to police it on Christmas Day, it’s probably just not worth having the lockdown. Potential uproar on both sides.
Now we're left putting unnecessary pressure on a bowing health service because we didn't make use of all options. And all this for a disease which - despite it's horrific impact , and one which has touched me personally - still isn't that bad compared to other potential pandemics we've either previously avoided/may still come.
Suv666
Full Member
- Joined
- Feb 11, 2016
- Messages
- 8,767
I think I've caught it. Have an insanely bad cough since morning now. Antibiotics arent working. Have isolated myself will try to get tested tommorow
Nytram Shakes
cannot lust
I honestly dunno how people are handling it in other countries, i would guess that it isn't just UK people who are acting like spoilt brats but i don't live in those countries so I won't coment.Slight problem with that theory: it is not just the UK government relaxing restrictions for the holidays
Also, I don't just blame the UK government I think the people of the UK need to take and equal (if not the majority of the blame) people are demanding the relaxing for xmas it's very clear that even if the government didn't allow it then a majority of people would just ignore the rules anyway.
Last edited:
Judas
Open to offers
France seems to be handling it in a much more strict manner going by what friends have told me, I think we've got off so lightly in this country and the government have just put faith and trust into the public to do the right thing. Seems like laziness and a desperate attempt to please.